D&AVIZ

D&AVIZ: AI Tool for Vibrant Data Visuals

D&AVIZ: An AI tool turning raw data into vibrant visuals. D&AVIZ revolutionizes insights with smart, stunning visualizations.

🟢

D&AVIZ - Introduction

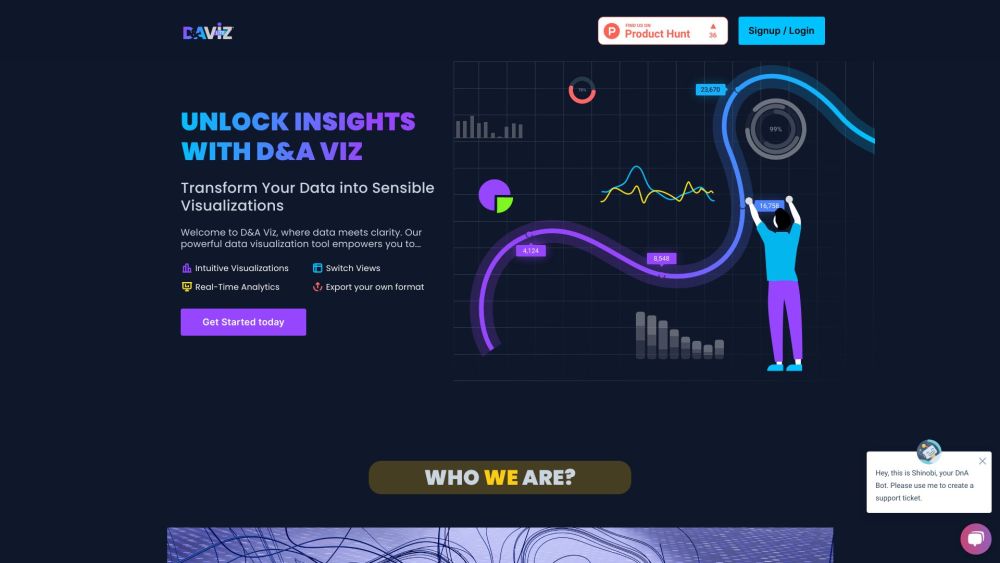
D&AVIZ Website screenshot

What is D&AVIZ?

D&AVIZ is an intelligent AI-powered platform designed to convert unstructured data into dynamic, eye-catching visual representations. By harnessing advanced algorithms, it simplifies complex datasets into clear, visually compelling graphics that enhance understanding and communication across teams.

How to use D&AVIZ?

Getting started with D&AVIZ is effortless—simply import your data via Excel or CSV uploads, ask questions using natural language prompts, and let the AI generate instant visual outputs like bar charts, line graphs, pie charts, and more. Transform numbers into narratives in seconds, empowering smarter business decisions with minimal effort.

🟢

D&AVIZ - Key Features

Key Features From D&AVIZ

Smart Visualization Engine

Automatically recommends the best chart types based on your dataset for maximum clarity.

Live Data Processing

Analyze and visualize information in real time, enabling up-to-the-minute insights.

Multiple View Options

Switch seamlessly between table, graph, and dashboard views to explore data from every angle.

Flexible Export Capabilities

Download visuals in various formats—including PNG, PDF, and CSV—for easy sharing and reporting.

  • D&AVIZ Company

    D&AVIZ is developed by Arivu IQ, Corp., a forward-thinking technology company focused on AI-driven data innovation.

🟢

D&AVIZ - Frequently Asked Questions

FAQ from D&AVIZ

What is D&AVIZ?

A cutting-edge AI tool that turns raw, complex data into vibrant, intuitive visualizations for better insight and decision-making.

How to use D&AVIZ?

Upload your Excel or CSV file, interact with the AI through simple queries, and receive instant, professional-grade visual reports tailored to your needs.

How do I upload data to D&AVIZ?

You can quickly import data by uploading standard Excel (.xlsx) or comma-separated (CSV) files directly into the platform.

Can I customize the visualizations?

Absolutely! D&AVIZ offers full customization options for colors, labels, layouts, and chart styles to match your brand or preferences.

How can I share my insights?

Create interactive dashboards and share them via links or exported files, making collaboration seamless across teams and stakeholders.

What are the benefits of visualizing data?

Data visualization helps uncover trends, improves comprehension, supports strategic planning, and makes presentations more engaging and impactful.

How can I contact D&AVIZ for support?

Reach out through the contact form on our website, and our support team will respond promptly to assist you.